

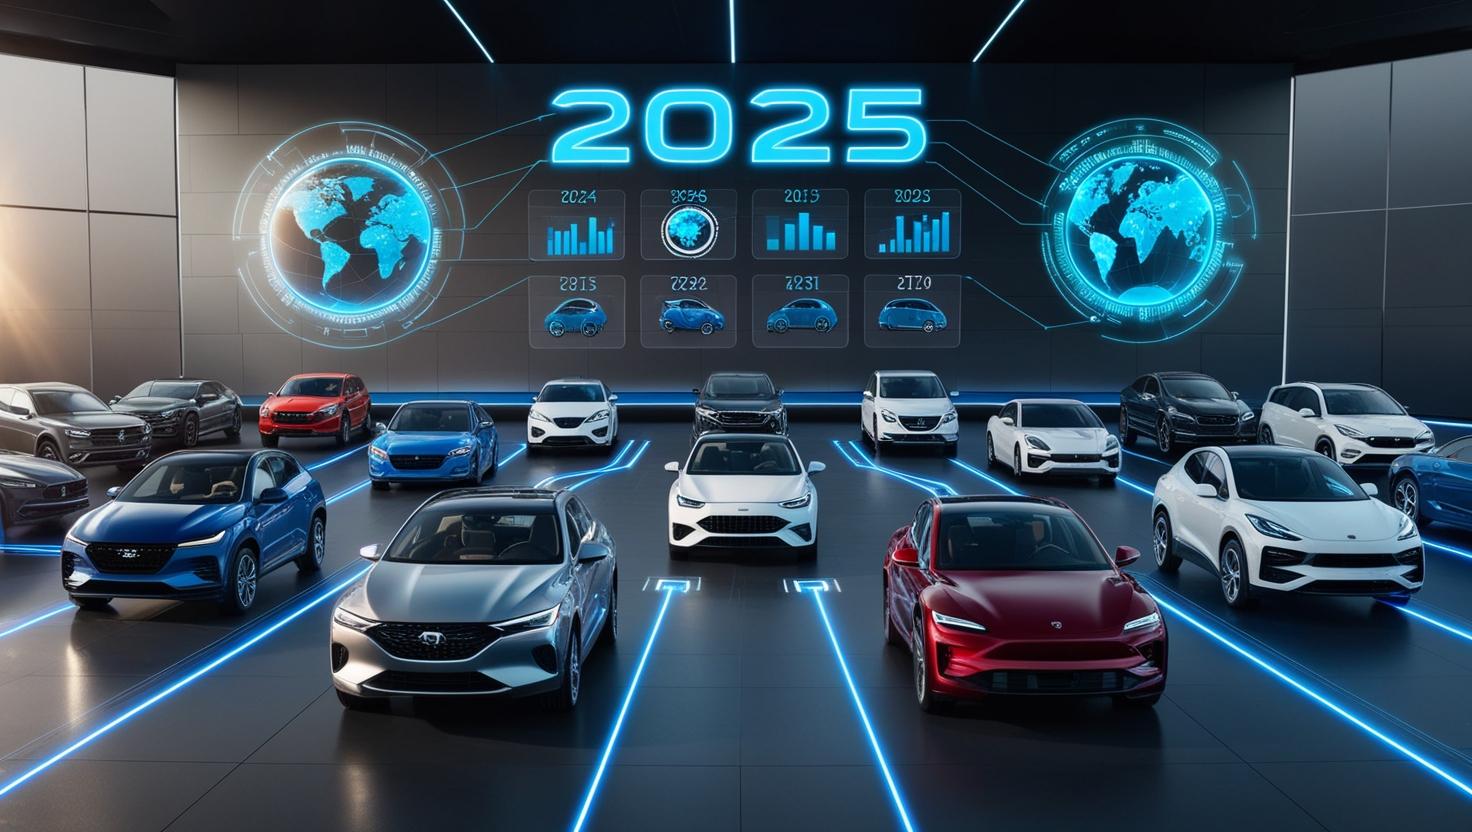
Seeking the most comprehensive and up-to-date global automotive industry statistics for 2025? You’ve arrived at the definitive guide. The automotive world is navigating unprecedented transformation, driven by electrification, autonomous technology, shifting economic currents, and evolving regulations. Understanding the key data points is essential for strategizing and navigating this dynamic landscape.
This cornerstone post compiles over 100 crucial automotive statistics, market insights, and key trends shaping 2025. We delve into global sales forecasts, explosive EV growth data, autonomous vehicle market penetration, critical regional analysis, top manufacturer performance, and vital aftermarket figures.
Top Global Automotive Industry Statistics (2025 Snapshot)
Let’s begin with the most impactful headline figures providing a snapshot of the 2025 automotive industry:
- Global Light Vehicle Sales Forecast (2025): Expected range between ~85.1 million and 91.6 million units, with some broader forecasts reaching 98.7 million.
- Global Light Vehicle Production Forecast (2025): Estimated at ~92.3 million units, a modest +2.4% YoY growth.
- Global EV Sales Growth (Q1 2025 YoY): A strong +29% year-over-year increase globally.
- Global EV Market Share Forecast (2025): Electric vehicles projected to capture ~18% to 25% of new vehicle sales.
- Autonomous Vehicle (AV) Market Size (2025): Forecasted to hit ~$99.37 billion, up from $73.53B in 2024.
- Total Cars Globally: Approximately 1.47 billion vehicles currently in operation worldwide.
- Largest Auto Market (Sales): China retains its top position, selling 25.8 million units in 2023 and leading 2025 forecasts.
- Largest Auto Producer (Volume, 2023): China produced ~26 million passenger cars, 33% of the global total.
- Top Manufacturer (Units Sold, 2023): Toyota led globally with ~11.2 million units.
- Top Manufacturer (Revenue, LTM): Volkswagen AG reported the highest revenue in recent reporting periods.
- Most Valuable Auto Brand (2025): Toyota ($64.7 billion), overtaking Mercedes-Benz and Tesla.
- Fastest Growing Auto Brand (Value, 2025): Ferrari saw a 36% increase in brand value.
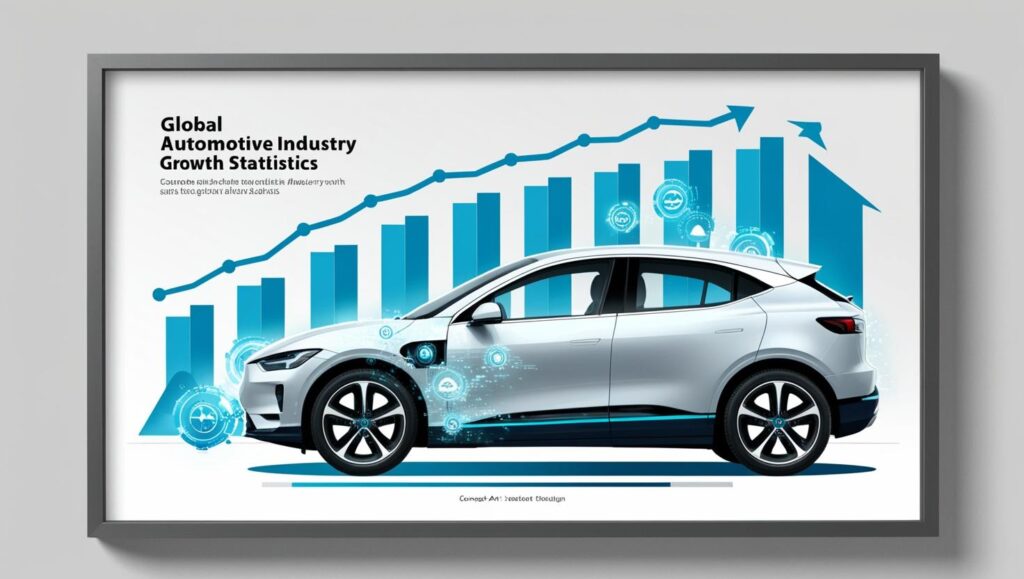
2025 Global Vehicle Sales & Production Statistics: A Detailed Look
Global car sales data and vehicle production numbers for 2025 reflect cautious optimism amid economic pressures and regional disparities.
- Forecasted Global Sales Growth (2025): YoY growth ranges from 1.3% to 3.4%.
- Global Light Vehicle Market Value (Units, 2024): Estimated at 84 million units.
- US Market Performance (2024 Est.): Reached ~16.0 million light vehicle sales, a modest 2.6% gain over 2023.
- US Market Forecast (2025): Projected sales of 16.2 million light vehicles.
- China Market Performance (2024 Est.): Grew by 0.9% to 25.5 million light vehicles.
- China Market Forecast (2025): Expected to reach 26.8 million light vehicles, spurred by incentives. S&P Global Mobility projects 30.5 million LVs produced in Greater China for 2025, a 1.4% decrease from 2024 due to export challenges.
- Europe Market Outlook (2025): Remains sluggish, with Western Europe lagging pre-pandemic levels significantly. Production forecast: ~17.6 million LVs (+0.9% YoY).
- Europe Market Performance (2024 Est.): Pan-European LV production fell to 17.45 million (-3.0% YoY).
- India’s Market Position: Became the 3rd largest market in 2023 with 4.11 million units sold, surpassing Japan (4M).
- Germany’s Market Position: Ranked 5th in sales (2023) with 2.8 million units.
- Average US Vehicle Price (Sept 2024): MSRP reached $52,066, with average dealer list price at $48,460.
- US New Car Price Increase (Since 2000): Prices jumped 56% from ~$21,850 to over $40,000 in two decades.
- Top Car Exporters (Value, 2023): 1. Germany ($177.2B), 2. Japan ($110.9B) (G2 Learning Hub).
- Top Car Producers (Volume, 2023): 1. China (~26M), 2. Japan (~7.7M), 3. India (~4M+), 4. Germany (~4M+).
- Used Car Market (Online, 2024): Close to 18.46 million used cars were sold globally.
- Projected Manufacturing Output Growth (Global, 2025-2029): Expected YoY growth between 3% to 5%.
Sources: GlobeNewswire, Just Auto, GlobalData, G2 Learning Hub, Automation
Electric Vehicle (EV) Statistics 2025: Unpacking the Surge
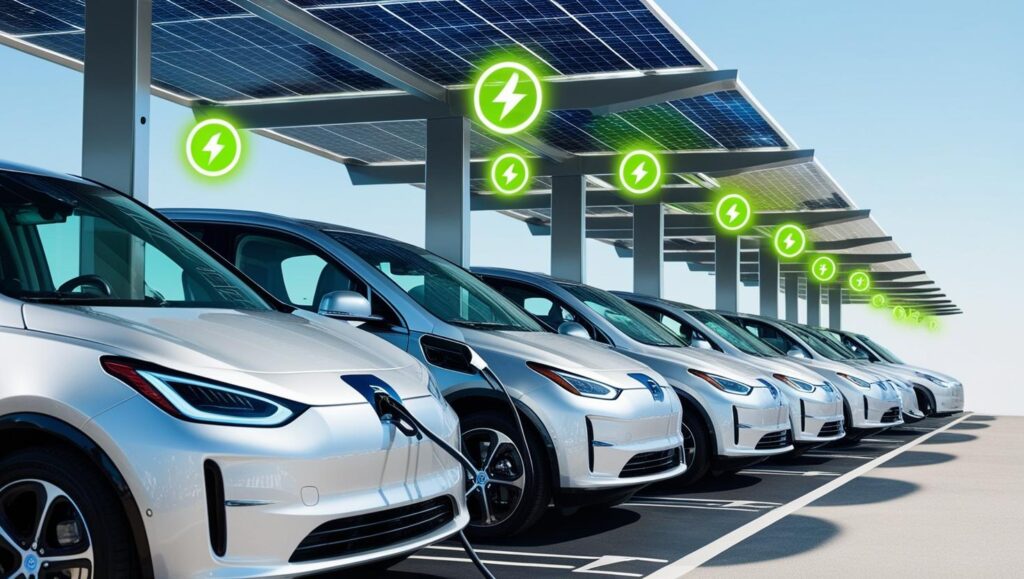
The electric car industry growth is undeniable. Explore key EV sales data, market share penetration, and infrastructure statistics for 2025.
- Projected Global EV Sales (Units, 2025): Forecasted to reach ~20 million units.
- Global EV Sales Growth Rate (Forecast 2025): Expected increase of ~35% over 2024.
- Global EV Market Share (New Sales, 2025): Estimated 18% to 25%.
- China’s Share of Global EV Sales: Accounts for ~60-65% of all EVs sold globally.
- China EV Sales Milestone: Predicted to potentially see EV sales outstrip Internal Combustion Engine (ICE) sales for the first time in 2025.
- Regional EV Market Growth (Q1 2025 YoY): North America: +16%; Europe: +22%; China: +36%.
- European BEV Growth (Q1 2025 YTD): Germany: +37%; Italy: +64%; UK: +42%.
- UK EV Sales Record (March 2025): Over 100,000 EVs sold in a single month for the first time.
- French EV Market (Q1 2025 YTD): Sales down 18% due to reduced subsidies (BEVs -5%, PHEVs -47%).
- PHEV vs BEV Trend: Some forecasts suggest Plug-in Hybrids (PHEVs) may lead sales growth over Battery Electric Vehicles (BEVs) in the near term as BEV growth potentially slows.
- EV Battery Demand Growth (2025): Forecasted +35% increase.
- China’s Battery Dominance: Manufactures over 50% of EV batteries and ~75% of battery components.
- EV Battery Technology: Shift towards solid-state batteries (higher energy density, safer) from Lithium-ion is a key trend.
- EV Charging Time: Average charging time ranges from 20 minutes to a few hours, depending on car and charger type.
- EU Charging Mandate (Effective 2025): Requires public charging points every 60 km along TEN-T core network routes.
- Global EV Fleet Size (End of 2025): Expected to surpass 56 million pure electric vehicles.
- EV Affordability Barrier: 27% of UK drivers cited cost as a major reason for not buying an EV (2023 data).
- Leading Chinese EV Manufacturer (Deliveries 2024): BYD delivered 4.27 million EVs and PHEVs.
- Tesla Price Cuts (Early 2025): Reduced Model 3/Y prices by up to 6% (~15,000 CNY) in China.
- BYD Price Cuts (Early 2025): Implemented 10-20% reductions on various models.
- US EV Production: Around three-fifths of EVs sold in the USA (2024) were domestically produced.
- Hyundai-Kia US EV Market Share: Reached 8% market share, becoming the 2nd largest EV seller in the US (overtaking GM/Ford).
Sources: GlobeNewswire, Cardino, Virta, Epicflow, S&P Global Mobility
Autonomous Vehicle (AV) Market Statistics & Tech Trends (2025)
Self-driving car statistics and autonomous vehicle market data reveal rapid innovation alongside regulatory and safety considerations.

- Global AV Market Size Forecast (2025): $99.37 billion.
- AV Market Growth Rate (CAGR 2025-2029): High exponential growth projected at 30.1%.
- AV Market Size Forecast (2029): Expected to reach $285.08 billion.
- Heavy-Duty AV Market Size (2024): $43.8 billion.
- Heavy-Duty AV Market Growth (CAGR 2025-2034): Forecasted at 14.3%.
- Heavy-Duty AV Propulsion (2024): ICE segment dominated with 60% market share.
- Heavy-Duty AV Vehicle Type (2024): Trucks held a dominant share of 68.8%.
- North America Heavy-Duty AV Market (2024): Generated $14.6 billion.
- Automation Level Adoption: Level 2 features becoming standard; Level 2+ (hands-off under conditions) growing in availability.
- Level 3 Availability: Mercedes-Benz Drive Pilot approved in parts of the US and Germany.
- Robotaxi Market Value Forecast (Vehicle Sales, 2045): $174 billion.
- Robotaxi Market Growth (CAGR 2025-2045): Projected 37%.
- Robotaxi Service Revenue Forecast: Potential for $1 Trillion cumulatively before 2045.
- Robotaxi Funding: Over $37 billion invested in robotaxi companies.
- AV Safety Claims: Waymo claims its system is already safer than human drivers based on specific studies.
- AV Crashes (ADS-equipped, Monthly 2024): Ranged between 22 and 80 crashes per month in the US.
- AV Crashes by Company (Cumulative): Waymo reported 739, Cruise 155, Transdev 134, Zoox 74 (Note: Doesn’t account for miles driven per fleet).
- AV Sensor Suite: Typical suites include Cameras, Radar, and often LiDAR for higher automation levels.
- LiDAR Adoption: Increasingly used for Level 3+ systems, particularly prominent in the Chinese market.
- Key Tech Trend: Software-Defined Vehicles (SDVs): Central to future architectures, enabling updates and new features.
- Key Tech Trend: Connectivity: 5G adoption enhancing V2X (Vehicle-to-Everything) communication for safety and infotainment.
- Key Tech Trend: In-Cockpit AI: Used for voice assistants, driver monitoring, and personalization.
- Mobility-as-a-Service (MaaS): Growing market encompassing ride-sharing, car-sharing, etc., facilitated by connectivity.
Sources: GlobeNewswire, Cardino, Virta, Epicflow, S&P Global Mobility, The Business Research Company, TechInsights, IDTechEx, Consumer Shield/NHTSA
2025 Regional Automotive Market Statistics & Deeper Trends
A granular look at regional automotive market analysis reveals unique opportunities and headwinds.
- China: Dominant force. NEV (New Energy Vehicle) sales outsold ICEs in the passenger vehicle sector in H2 2024. Government extended scrapping subsidies to end of 2025. Key player in EV battery supply chains. Architecture change leader.
- USA: Robust but facing affordability issues and potential tariff impacts (predicted higher tariffs affecting China, Mexico, Canada). Inventory levels stabilizing after disruptions. Companies offering reliable vehicle logistics, such as A1 Auto Transport, play a vital role in ensuring smooth cross-border shipments and helping OEMs and dealers navigate complex tariff-driven supply chain challenges. 10% reciprocal tariffs factored into some EU production forecasts.
- Europe: Facing “demand-led outlook deterioration”. EU’s 2025 CO2 target: 93.6 g/km average for new cars. Regulatory environment generally favorable to Independent Aftermarket (IAM) compared to the US.
- India: High growth potential, investing $15 billion into semiconductor production . Projected to drive VIO growth alongside China.
- Japan & South Korea: Production forecasts lowered by ~300,000 units/year (Japan) and ~200,000 units/year (Korea) for 2026-2027 due to US tariff assumptions.
- Emerging Markets (EVs): Key growth drivers include Chile, Turkey, Taiwan/China, Qatar, New Zealand, Czech Republic, Ecuador, Panama, Greece, Argentina (Top 10 fastest growing 2025 forecast). Local manufacturing and innovation (e.g., cost-effective EVs) are key.
- ASEAN: High manufacturing growth potential, focus on semiconductor production/testing (e.g., Singapore). Thai exports face challenges from US tariffs.
- South America: Production outlook reduced slightly due to broader supply chain/demand impacts, less direct tariff effect.
- Germany: Experiencing deindustrialization concerns in its large auto sector.
Sources: GlobeNewswire, Just Auto, GlobalData, G2 Learning Hub, Automation, S&P Global Mobility, The Business Research Company, TechInsights, Autokunbo
Top Automotive Companies 2025: Performance & Financial Stats
Dive deeper into leading automotive manufacturer statistics, including growth rates and brand strength.
- Volkswagen Group (Revenue Growth, LTM Q3 2023): +16.9%.
- Toyota Motor Corp (Revenue Growth, LTM Q4 2023): +22.9%.
- Stellantis NV (Revenue Growth, LTM 2023): +8.4%.
- Ford Motor Co (Revenue Growth, LTM 2023): +11.5%.
- General Motors Co (Revenue Growth, LTM 2023): +9.6%.
- BMW AG (Revenue Growth, LTM Q3 2023): +15.6%.
- Honda Motor Co Ltd (Revenue Growth, LTM Q4 2023): +18.2%.
- Hyundai Motor Co (Revenue Growth, LTM 2023): +14.4%.
- Tesla Inc (Revenue Growth, LTM 2023): +18.8%. Projected 2025 growth expected to be “significantly lower”.
- BYD Co Ltd (Revenue Growth, LTM Q3 2023): Explosive +60.3%.
- Kia Corp (Revenue Growth, LTM 2023): +15.3%.
- Tata Motors Ltd (Revenue Growth, LTM Q4 2023): Impressive +76.9%. Achieved highest Brand Strength Index (BSI) score 94.3/100 (AAA+ rating) based on India performance.
- Top Auto Component Suppliers (Brand Value, 2025): 1. Bosch ($7.3B), 2. Hyundai Mobis ($6.3B), 3. Denso ($5.9B), 4. Toyota Industries ($3.9B), 5. Magna ($3.1B).
Sources: Aranca, Cardino, Brandirectory.
Automotive Aftermarket Statistics (2025 & Beyond)
The vital car aftermarket industry presents its own set of significant numbers and trends.
- Global Vehicles In Operation (VIO) Forecast: Light vehicles reaching 1.7 billion and Medium/Heavy Commercial Vehicles 85 million by 2033.
- Out-of-Warranty Vehicles (China, End 2025 Est.): ~245 million, equating to ~72% of the fleet.
- Key Aftermarket Drivers: Vehicle longevity, sheer VIO volume (esp. China/India), EV adoption, ADAS tech proliferation, connected car services.
- CASE Vehicles: Connected, Autonomous, Shared, and Electrified vehicles are driving the need for specialized aftermarket solutions.
- ADAS Impact: Repair and maintenance training for ADAS, plus managing OTA (Over-the-Air) software updates, are crucial for IAM provider relevance.
- Regional Aftermarket Differences: Europe’s legislation favors IAM growth, while OEMs hold a stronger position in the US market.
Source: S&P Global Mobility
Conclusion: Your Guide to Automotive Industry Statistics 2025
This comprehensive compilation of 100+ global automotive industry statistics for 2025 underscores a sector at a pivotal juncture. The relentless push towards EV adoption, rapid advancements in autonomous driving technology, diverging regional market trends, and the strategic maneuvers of leading manufacturers define the current landscape. While economic headwinds and regulatory shifts present challenges, the overwhelming data points towards continued innovation.
Understanding these car industry growth statistics, EV sales data, and automotive technology trends is paramount for anyone invested in the future of mobility. This guide serves as your cornerstone resource for navigating the complexities and opportunities of the automotive world in 2025 and beyond.