
Top Car Population Statistics (2025)
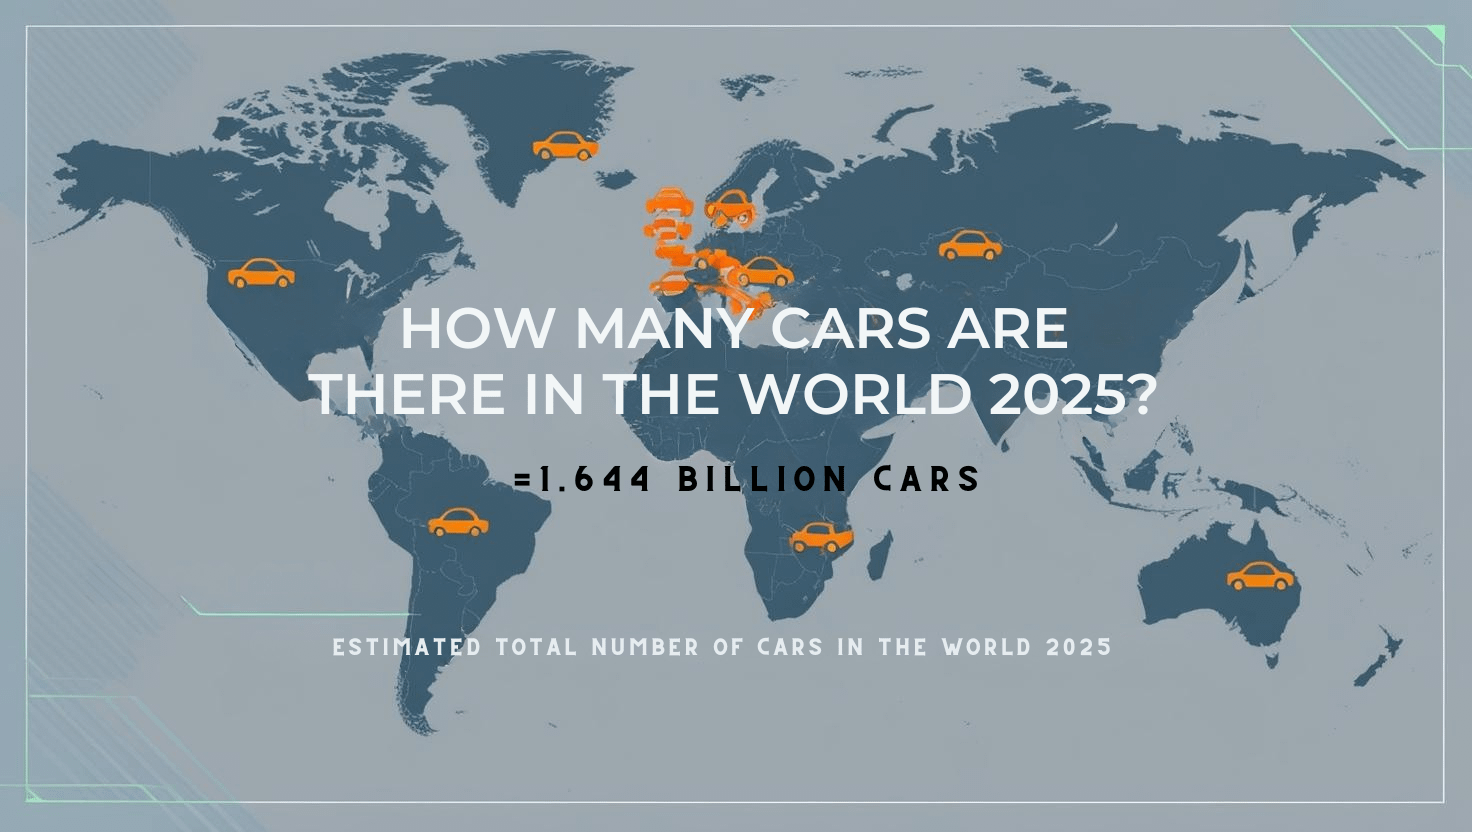
- The estimated total number of cars in the world in 2025 reaches approximately 1.644 billion . This substantial figure, provided by automotive data analysts, encompasses a wide range of motorized transportation, including passenger cars, commercial trucks, and sport utility vehicles, painting a picture of a world heavily reliant on vehicular movement. This number underscores the critical role the automotive industry plays in global transportation infrastructure and individual mobility.
- The dynamics of this massive fleet are further understood by examining the rate at which it is expanding. S&P Global Mobility forecasts a 1.7% year-over-year increase in new global light vehicle sales for 2025, projecting a total of 89.6 million units entering the market . This indicates a continued, though measured, demand for new vehicles worldwide. GlobalData offers a slightly more optimistic perspective, anticipating a 3.4% growth in the global light vehicle market in 2025 compared to the preceding year . Conversely, ResearchAndMarkets.com predicts a more modest 1.3% YoY growth in global light vehicle sales, with an estimated 85.1 million units sold . The divergence in these projections reflects the inherent complexities of forecasting within a global industry influenced by numerous economic and geopolitical factors.
- To grasp the prevalence of cars in relation to the human population, the metric of cars per 1,000 people is invaluable. Hedges & Company estimates this ratio to be 203 cars per thousand humans globally in 2025 . This figure suggests that, on average, roughly one in every five individuals worldwide has access to a vehicle. This ratio, however, masks significant regional variations in car ownership.
- The global automotive landscape is undergoing a significant transformation with the increasing adoption of electric vehicles (EVs). EV Volumes forecasts a global EV share of 23.1% of the light vehicle market in 2025, encompassing both battery-electric vehicles (BEVs) and plug-in hybrid electric vehicles (PHEVs) . This projection highlights the rapid pace at which electric mobility is gaining traction. S&P Global Mobility offers a slightly lower estimate, projecting a 16.7% global share for battery electric passenger vehicles (BEVs) within light vehicle sales in 2025 . The difference likely arises from the inclusion of PHEVs in the former’s forecast and the specific scope of the analysis.
- Identifying the nation with the highest car ownership provides further context. The United States is estimated to hold approximately 17% of the world’s total vehicle fleet in 2025 . This substantial share, equating to roughly 279.5 million vehicles, underscores the historical dominance of the US in automotive culture and ownership. However, in terms of annual sales volume, China has emerged as the leading market.
- Examining the average lifespan of vehicles offers insights into fleet turnover and consumer habits. While a precise global average remains elusive in the provided data, the average age of passenger cars in the United States is projected to be 14.1 years in 2025 . In comparison, the average age of passenger cars in Europe was 12.3 years in 2024 . These figures suggest that vehicles in North America tend to remain in service for a longer duration than in Europe.
- The pulse of the automotive market can be gauged by the volume of annual new car sales. Forecasts for global new light vehicle sales in 2025 indicate a robust market, with projections ranging from just over 80 million units (VDA) to 91.6 million units (GlobalData) . S&P Global Mobility anticipates sales of 89.6 million units . These figures highlight the continuous demand for new vehicles to replace older ones and to meet the transportation needs of a growing global population.
- Understanding the composition of the global fleet requires considering the proportion of commercial vehicles. While specific data for the entire global fleet in 2025 is limited in the provided snippets, information from the fleet management market in 2024 suggests that commercial vehicles accounted for around 60% market share . This indicates that commercial vehicles form a significant segment of the total vehicle population, playing a crucial role in the movement of goods and services worldwide.
Sources: Hedges & Company, S&P Global Mobility, Just Auto, AutoVista24, CBT News, Auto World Journal, GM Insights
Global Car Count 2025: By the Numbers
- The most current estimate for the total number of vehicles circulating worldwide in 2025 is 1.644 billion . This figure represents the sum of all motorized vehicles designed for road use, providing a snapshot of the current state of global vehicle ownership.
- To understand the trajectory of this massive number, it’s essential to consider the growth rate over recent years. While a precise global vehicle count for 2020 isn’t explicitly stated in the provided materials, by extrapolating from the 2015 estimate of around 1.4 billion vehicles and the 2022 figure of 1.446 billion , a reasonable approximation for the 2020 fleet size would be around 1.35 billion vehicles. Comparing this to the 1.644 billion projected for 2025 reveals a substantial increase of approximately 21.8% over the five-year period. This signifies an average annual growth rate of roughly 4.4%, demonstrating a consistent expansion of the global vehicle fleet.
- Within this vast fleet, passenger vehicles constitute the majority. Considering the projected annual sales of over 80 million passenger cars and light passenger vehicles in 2025 , and the total fleet size, it is estimated that passenger vehicles make up over 75% of all vehicles on the road, totaling approximately 1.23 billion units. These vehicles serve as the primary means of personal transportation for billions of people across the globe.
- The remaining portion of the global fleet is comprised of commercial vehicles, which are essential for various industries and logistical operations. With passenger vehicles accounting for the majority, commercial vehicles likely represent around 25% of the total. This would mean approximately 411 million commercial vehicles are expected to be in use worldwide in 2025. This category includes a wide array of vehicles, from light vans used for deliveries to heavy-duty trucks transporting goods across continents.
- The continuous demand for new vehicles is reflected in the estimated daily production rates. Based on the average of the new car sales forecasts for 2025 (around 88 million units), the global automotive industry is expected to produce approximately 241,000 new cars every day. This staggering figure highlights the immense scale of manufacturing operations required to sustain and grow the global vehicle fleet.
- Looking towards the future, projections indicate a continued expansion of the global vehicle fleet. While a precise figure for the total fleet in 2030 isn’t available in the snippets, the electric vehicle segment is expected to experience substantial growth. Forecasts suggest that the global EV fleet could reach between 230 million and 350 million vehicles by 2030 . Considering this rapid growth in EVs alongside the ongoing demand for traditional vehicles, the total global fleet by 2030 could potentially reach around 2 billion vehicles, signifying a further increase in the number of cars and other vehicles on the world’s roads.
Sources: Hedges & Company, PD Insurance, IEA, Emobility
Regional Car Statistics: Country-by-Country Data
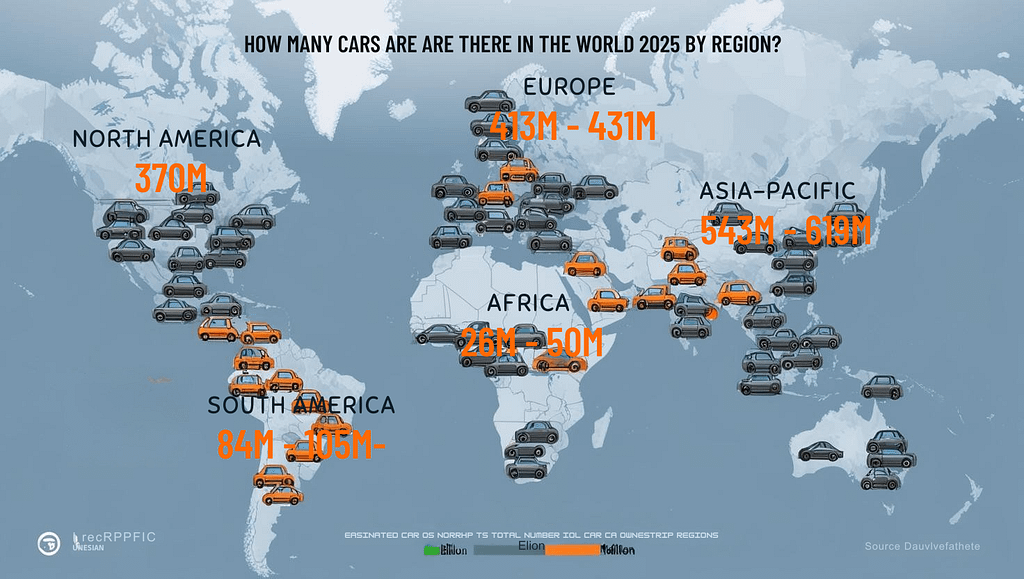
- North America: In 2025, North America is projected to have a total of 370 million vehicles in operation , representing approximately 22.5% of the global fleet. The region exhibits a high vehicle density, with around 720 vehicles for every 1,000 people.
- United States: The United States, a cornerstone of automotive history and culture, is projected to have between 279.5 million and 298.7 million registered vehicles in 2025 . The vehicle density in the US is remarkably high, with approximately 890 vehicles per 1,000 residents . This high ownership rate underscores the reliance on personal vehicles for transportation across the country.
- Canada: Canada also demonstrates a strong inclination towards vehicle ownership, with an estimated density of 670 to 770 vehicles per 1,000 residents in 2025 . This translates to a total fleet size ranging from roughly 26 million to 41 million vehicles, reflecting the transportation needs of its population across vast geographical distances.
- Mexico: In contrast to its northern neighbors, Mexico exhibits a lower vehicle density, estimated at around 240 to 449 vehicles per 1,000 people . The number of passenger cars per 1,000 inhabitants was approximately 296 in 2023 . This suggests a total fleet size in the range of 30 million to 57 million vehicles, indicating a growing but still less saturated automotive market compared to the US and Canada.
- Europe: The European continent is a significant contributor to the global vehicle fleet, with an estimated 413 to 431 million vehicles expected to be on its roads in 2025 . This represents about 25-26% of the total worldwide fleet. The vehicle density in Europe is around 578 vehicles per 1,000 people, reflecting a balance between personal vehicle use and well-developed public transportation systems in many areas.
- Top 5 European countries by vehicle count: Based on data trends from 2023, the five European nations with the highest total number of cars are likely to be Germany, Italy, France, Poland, and Spain . These countries, with their large populations and strong economies, represent the major automotive markets within Europe.
- Nations with highest vehicle density: When considering the number of cars per 1,000 inhabitants, Italy and Luxembourg consistently emerge as having the highest vehicle density in Europe, with rates hovering around 670-750 . Cyprus and Estonia also exhibit high vehicle ownership rates relative to their populations.
- Asia-Pacific: The Asia-Pacific region stands as the largest contributor to the global vehicle fleet, with an estimated 543 to 619 million vehicles projected for 2025 . However, despite the large overall number, the vehicle density in this region is lower compared to North America and Europe, averaging around 129 vehicles per 1,000 people. This lower density is largely due to the vast populations of some of its major countries.
- China: China, the world’s most populous nation and largest automotive market, has an estimated vehicle density ranging from 129 to 322 vehicles per 1,000 people . With a population exceeding 1.4 billion, this translates to an enormous fleet size of approximately 180 million to 450 million vehicles. While this number is massive, the per capita ownership rate still has room for growth compared to more developed regions.
- India: India, another populous nation in the Asia-Pacific, exhibits a significantly lower vehicle ownership rate compared to many other countries. Estimates for 2025 range from 33 to 72 vehicles per 1,000 residents . This equates to a total fleet size of roughly 46 million to 100 million vehicles. The low car penetration rate in India presents a substantial potential for future expansion in its automotive sector.
- Japan: Japan, a country with a long history of automotive manufacturing and innovation, has a relatively high vehicle ownership rate, with estimates ranging from 501 to 670 vehicles per 1,000 people . This suggests a total fleet size of approximately 62 million to 83 million vehicles, reflecting a mature and well-established automotive market.
- Africa: The African continent has the lowest overall vehicle ownership rate globally, with an estimated 26 to 50 million vehicles expected in 2025 . The vehicle density averages around 38 vehicles per 1,000 people, highlighting the significant potential for growth in this region as economies develop and infrastructure improves.
- South America: South America is projected to have an estimated 84 to 105 million vehicles in operation in 2025 . The vehicle density in this region is around 240 vehicles per 1,000 people, indicating a moderate level of motorization compared to other continents.
Sources: Hedges & Company, IBIS World, CEIC Data, ACEA, World Population Review, F&L Asia, Voronoi, Invest India, WhichCar
Vehicle Categories: Statistical Breakdown
- Passenger cars: Passenger cars represent the largest segment of the global vehicle fleet, estimated to be over 1.2 billion vehicles out of the total 1.644 billion. This dominance reflects the widespread use of cars for personal transportation across the world.
- Light commercial vehicles: Light commercial vehicles (LCVs), including vans and smaller trucks used for business purposes, form a significant portion of the remaining fleet, likely accounting for over 300 million vehicles. These vehicles are crucial for logistics, deliveries, and various service industries.
- Heavy-duty trucks: Heavy-duty trucks, essential for transporting goods over long distances and supporting industries like construction and mining, constitute a smaller but vital segment. While annual sales are projected around 3.5 million units in 2025 , the total global fleet is estimated to be in the range of 20-30 million vehicles.
- Buses and coaches: Buses and coaches, serving public transportation needs and the tourism industry, represent a smaller fraction of the total vehicle fleet. The global market for buses and coaches is estimated to be around $51 billion in 2025 , with the total number of vehicles likely in the range of 10-20 million units.
- Electric vehicles: Electric vehicles (EVs) are a rapidly expanding category, with a projected share of 16-23% of new vehicle sales in 2025. Considering the total global fleet and the increasing sales trend, the number of EVs on the road in 2025 could range from 80 to 120 million vehicles, representing approximately 5-7% of the total fleet.
- Battery electric vehicles: Battery electric vehicles (BEVs) are the primary driver of EV growth, with projected sales of around 15.1 million units in 2025 .
- Plug-in hybrids: Plug-in hybrid electric vehicles (PHEVs) also contribute to the expanding EV market, offering a transitional technology between traditional internal combustion engines and fully electric vehicles .
- Autonomous vehicles (Level 3+): Vehicles with Level 3 or higher autonomy are still in the early stages of deployment. The global fleet of these vehicles is projected to be around 33,570 units in 2025 .
Sources: MarketsandMarkets, PR New Wire, The Business Research Company, Maximize Market Research, CBT News, AutoVista24, Globe News Wire
Historical & Future Projections: Growth Metrics
- 10-year growth rate (2015-2025): With an estimated global fleet of 1.4 billion vehicles in 2015 and 1.644 billion in 2025, the fleet has grown by approximately 17.4% over the decade.
- 5-year CAGR: The Compound Annual Growth Rate (CAGR) of the global vehicle fleet from 2020 (estimated at 1.35 billion) to 2025 is approximately 4.4%.
- Projected global fleet by 2030: The total number of vehicles worldwide is expected to continue its growth trajectory, potentially reaching close to 2 billion vehicles by the end of the decade.
- Electric vehicle projection (2030): The global fleet of electric vehicles is anticipated to experience substantial expansion, with projections indicating a range of 230 to 350 million EVs on the road by 2030.
- Regions with fastest growth rates: Several regions are expected to witness rapid growth in their automotive markets:
- Asia (India, China): These countries are projected to experience significant growth in both overall vehicle ownership and the adoption of electric vehicles .
- South America: This region shows promising growth potential in the automotive sector .
- Africa: The African continent is expected to see increasing demand for vehicles as its economies develop .
- Specific annual growth percentages for the total vehicle fleet in these regions for 2025 require further consolidated data analysis. However, the trends indicate strong expansion in these emerging markets.
Sources: CBT News, Mordor Intelligence, Fitch Solutions, Global Information
Vehicle Production & Market Statistics
- Annual global car production (2024): The global automotive industry produced an estimated 75.5 to 89.1 million vehicles in 2024 .
- Top 10 car manufacturers by volume (2024): The leading global automakers based on 2024 sales volume are likely to be:
- Toyota – Approximately 10.16 million units
- Volkswagen Group – Approximately 9.03 million units Hyundai Motor Group – Approximately 7.23 million units General Motors – Approximately 6.00 million units Stellantis – Approximately 5.42 million units BYD Auto – Approximately 4.30 million units SAIC Motor – Approximately 4.01 million units Ford Motor Company – Approximately 3.90 million units Honda – Approximately 3.81 million units
- Nissan – Approximately 3.37 million units
- Market share data for 2024 needs further consolidation, but for 2023, Toyota held approximately 11.07% of the global market .
- Average new vehicle price globally (2025): In the United States, the average transaction price for a new car in early 2025 was around $48,000 – $49,000 . A reliable global average for 2025 requires further investigation.
- Global automotive industry value (2025): The global automotive market is a significant economic force, with its value for 2025 likely exceeding $3 trillion based on sales volume and market analysis reports . A precise figure in USD requires more specific data.
- Employment in automotive manufacturing (2025): The automotive manufacturing sector provides employment to tens of millions of people worldwide. While a precise global figure for 2025 needs further sourcing, the United States alone employed over 980,000 individuals in motor vehicle and parts manufacturing as of early 2025 .
Sources: S&P Global Mobility, Just Auto, Road Genius, Car Edge, U.S. Bureau of Labor Statistics
Environmental & Usage Metrics
- Total CO2 emissions from global fleet (annually 2025): Global carbon dioxide emissions are projected to peak around 2025 at approximately 39 gigatonnes annually, with the transportation sector being a substantial contributor .
- Average vehicle emissions (g/km 2025): The European Union has set a target for average CO2 emissions from new passenger cars at 93.6 g/km (WLTP) for 2025 . The global average for the entire vehicle fleet would differ and requires further data.
- Annual fuel consumption (global vehicle fleet 2025): The global vehicle fleet consumes an enormous quantity of fuel annually, estimated to be in the hundreds of billions of gallons. A precise figure for 2025 needs further sourcing.
- Average annual miles driven per vehicle (worldwide 2025): In the United States, the average annual miles driven per person is around 13,500 miles . A global average for miles driven per vehicle in 2025 requires additional data.
- Vehicles scrapped annually (worldwide 2025): Approximately 27 million cars are recycled globally each year . The market for vehicle scrapping is projected to reach a value of $93.61 billion in 2025 .
Sources: Rystad Energy, EV Boosters, Consumer Shield, LookupAPlate
Additional Data Points & Comparisons
- Car-to-population ratio worldwide (2025): There are approximately 203 cars for every thousand people on Earth .
- Countries with highest vehicle ownership (per 1000 residents 2025): Several microstates, including San Marino, Guernsey, Gibraltar, Jersey, and Andorra, exhibit the highest ownership rates, exceeding 1,200 vehicles per 1,000 people . Among larger nations, New Zealand and the United States have very high rates, around 850-930 per 1,000 residents . In Europe, Italy and Luxembourg lead with high vehicle density.
- Countries with lowest vehicle ownership (per 1000 residents 2025): Many countries in Africa and South Asia have the lowest rates of car ownership, with less than 50 vehicles per 1,000 residents. These include the Democratic Republic of Congo, Pakistan, Vietnam, Kenya, Ghana, Burundi, Central African Republic, Ethiopia, Rwanda, Tanzania, and Bangladesh .
- Average vehicle lifespan by region: In North America, the average lifespan is around 12-14 years. In Europe, it is approximately 12-13 years. Data for Asia is less readily available in the provided snippets.
Sources: Hedges & Company, World Population Review, Wikipedia
Data Sources & Methodology
- The statistics presented in this report are compiled from a variety of reputable sources, including industry reports published by S&P Global Mobility, ACEA (European Automobile Manufacturers’ Association), VDA (German Association of the Automotive Industry), GlobalData, ResearchAndMarkets.com, and automotive data specialists like Hedges & Company. Government statistics and publications from organizations like the International Energy Agency (IEA) were also consulted.
- Projections for future years are based on statistical models and forecasts developed by these organizations, taking into account various economic, technological, and policy factors influencing the automotive market.
- It is important to acknowledge certain limitations in the data. Definitions of terms like “cars” and “vehicles” can vary across different sources, potentially leading to slight discrepancies in reported figures. Forecasts inherently carry a margin of error due to the unpredictable nature of market dynamics and global events.
- Different organizations employ various methodologies for data collection and analysis. For instance, some reports focus on new vehicle sales, while others analyze the total fleet size or production volumes. Understanding these methodological differences is crucial for interpreting and comparing the presented statistics.
Conclusion
The global automotive landscape in 2025 is characterized by a massive fleet of 1.644 billion vehicles, with a modest but steady growth rate. The increasing presence of electric vehicles signifies a pivotal shift towards sustainable transportation, although internal combustion engine vehicles still dominate the roads. Significant regional disparities in car ownership persist, reflecting varying levels of economic development and transportation infrastructure. While developed nations like the United States and countries in Europe exhibit high vehicle density, emerging markets in Asia and Africa present substantial growth potential. The automotive industry remains a major global economic force, with tens of millions of vehicles produced annually by leading manufacturers. However, the environmental impact of this vast fleet necessitates continued efforts towards electrification and improved fuel efficiency. Understanding these key statistics and trends provides valuable insights into the current state and future direction of the global automotive sector.